OPTIMIZING AIRBNB RENTAL PRICES
Using machine learning to help home owners determine the optimal rental price for their Airbnb listing by analyzing data from 1,000+ homes and their amenities in Amsterdam, Netherlands.
Dataset: Airbnb public data
Technologies and Methods Used: R, Machine Learning and Data Mining (Ridge Regression, LASSO Regression, PCR, Cross-validation)

INTRODUCTION
One of the most difficult tasks for an AirBnb property listers is deciding on an optimal price - not too high and not too low. With the vast number of features and amenities that houses may contain, it seems almost impossible for property listers to decide how much their property is really ‘worth’. I developed a model to provide AirBnb listers an accurate estimate of their property’s worth based on its amenities as well as comparative pricing of other properties in the neighborhood.
THE DATASET
Airbnb data on listings in Amersterdam, North Holland, The Netherlands. This dataset included a total of 106 variables, such as price, neighborhood, and number of bedrooms.
WHO COULD BE INTERESTED IN THIS DATA?
Airbnb property owners will benefit by knowing reasonable listing prices given their property’s features and amenities.
Airbnb, Zillow, Trulia, and travel websites like Expedia will be able to use this data to compare prices on their properties against Airbnb listings depending on the neighborhood, amenities, size, etc.
HOW CAN THIS DATA BENEFIT DIFFERENT PERSONAS?
-
AirBnb listers will be able to estimate the mean price of a listing given possible predictors such as bedrooms, neighborhood, review score, etc
-
This would be helpful for Airbnb because they could add a feature on their website that would show mean prices for a listing given the features of the house
-
For renters, It could also be used to show comparative prices for listings
-
Owners can better understand what the public is looking for in an Airbnb and thus allow them to redesign their property to better accommodate the AirBnb customer base (in terms of types of amenities, # of amenities, # of beds etc).
METHODOLOGY
EXPLORATORY DATA ANALYSIS
The original dataset contained 106 variables, which were trimmed down to 60 after careful evaluation. Each variable in the original dataset was analyzed for its importance and significance to the final model. Variables such as pictures, urls for the postings, redundant data columns, empty columns, etc. were eliminated. 16 additional features were engineered based on the remaining variables.
Then, further data preprocessing was done, ensuring that the dataset is clean and suitable for analysis. Missing values for the variables "bedrooms," "bathrooms," and "beds" were removed to ensure data integrity.
CORE ANALYSIS
VARIABLE SELECTION AND METRIC SELECTION
The model employed Ridge and Lasso Regression to help with variable selection and regularization.
The dataset is split into training and test sets, with random sampling used to ensure representative data in both sets. The training set is used for model training and selection, while the test set is used for evaluating model performance.
Ridge regression is applied first. It introduces a penalty term to the regression coefficients, aiming to reduce multicollinearity and overfitting. Cross-validation is performed to identify the optimal lambda (penalty) value, which controls the strength of the penalty. Using this optimal lambda, the Ridge regression model is trained and evaluated on the test set.
Next, Lasso regression is employed. Similar to Ridge regression, Lasso regression introduces a penalty term to the coefficients, but with the added advantage of performing feature selection. By imposing a stronger penalty, Lasso regression can drive some coefficients to exactly zero, effectively selecting the most important variables. Cross-validation is conducted to find the optimal lambda value.
Principal Component Regression (PCR), which combines Principal Component Analysis (PCA) and regression, was chosen to further narrow down the number of predictors. PCR is used to handle high-dimensional data by transforming the predictors into a smaller set of uncorrelated variables called principal components. Cross-validation is performed to determine the optimal number of principal components.
Mean squared error (MSE) is used as an evaluation metric, measuring the average squared difference between predicted and actual values.
Predicted prices of rentals plotted against number of beds in the rental
PREDICTIVE MACHINE LEARNING MODELING
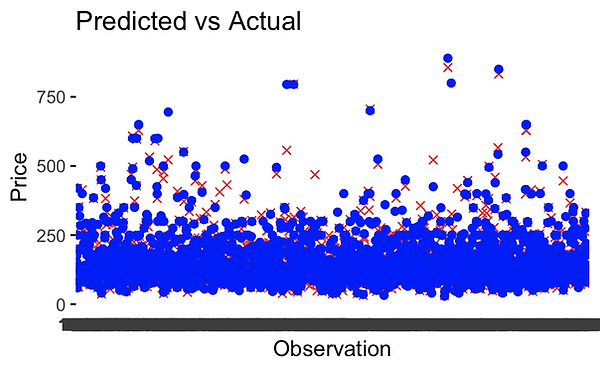
Finally, Lasso regression is used for prediction, and the MSE is calculated as an evaluation metric. Residual analysis and visualization are conducted to assess the model's performance.


FINAL RESULT AND INTERPRETATION
The final model performed incredibly well, achieving a mean squared error of just 2.82%.
This means that when estimating the price of a rental, the model, on average, deviates from the actual value by approximately 2.82%. Thus, such a model could be of immense value to homeowners, who could simply run their Airbnb listing and its features through this model to gain an accurate estimate of their rental value.